Question: How Much Acreage of Grain is Needed to Feed a Barn Owl?
We know that,
#of Mice= (Total weight of mice)/(Average weight of a mouse)
Total weight of mice= 20kg(as shown above)
Average weight of a mouse= 1g(according to a google search)
Now in order to correctly do this calculation we must use the same units, and for the purpose of not having very small numbers we are going to do this calculation in grams. First we must convert 20kg to grams.
We know that,
1kg=1000g
By using this scale, we are able to convert the 20kg to grams by doing the formula below
In 1927 the water levels in the Dead Sea began dropping. The Dead Sea is the lowest point on earth located between Jordan and Israel. The Dead Sea has a very high density of salt. The Dead Sea also serves as a holy site, a major economic gain, and a health benefit.In the past 60 years the Dead Sea has dropped 40m in depth. The rate is still increasing, and is now 1m/year, which while it may not seem like a lot, 1m of depth is over seven billion liters of water.
Can you explain to your classmate why temperatures from only a single year are not enough to reach a conclusion about changing climate? Use Figure 1.1 to construct your argument, noting when El Niño events occur, but also which years have the highest temperatures. How has the average annual temperature shifted through time? How do the temperatures in the El Niño years compare to the 1950–1970 average? To the 1985–2005 average?
Answer:
Changes in weather do affect climate over long periods of time. On the first graph provided, which maps average temperatures in the U.S. from 1950-1970 along with El Nino years, El Nino events are collectively lower than the El Nino events in the second graph, which has the same information dated from 1985-2005. And in the second graph, the average temperature is noticeably higher and El Nino events occur much more often. This proves that the more frequent the El Nino events happen, and the more extreme they are, the more they can noticeably impact a climate. So that classmate is wrong.
Part 2:
Year
CO2 PPM
1850
285
1900
300
1950
315
2000
350
2100
x>350
CO2 levels are increasing at an accelerating rate from decade to decade.
2. a) I would exaggerate the changes by changing the vertical scale.
b) I would obscure the changes by changing the horizontal scale.
3. Industrial Revolution
4. The graph shows that the rate of CO2 levels is increasing at accelerating speed. It implies that if we don't reduce CO2 emissions, the CO2 levels are likely to be rise exponentially.
Part 3:
Stop
# of Students
Miles to and from school
Total miles driven by all students living near that stop
A
2
0.3
0.6
B
2
1.1
2.2
C
2
2.2
4.4
D
3
2.9
8.7
E
2
3.6
7.4
F
2
2.2
4.4
G
2
2.4
4.8
H
2
3.8
7.6
I
3
2.6
5.2
J
3
1.5
4.5
K
2
0.8
1.6
Average:
5.4
2.
5.4 miles
135 miles
675 miles
3. 30.7 gal
4. 595.2 lb
5. 0.2976 tons
6. 9.2 miles
7. 0.368 miles/student
8. 65.7 mpg/week
9. 1274.9 lb
10. 0.637 tons
11. 2.339 tons
Part 4:
The X axis is the years from 0 to 2000 and the Y axis the differences from 1961-1990 average temperature in celsius.
The zero on the Y axis is the average temperature from 1961-1990.
It is a good baseline because the period of time from 1961-1990 is a time of extreme temperature change so the fluctuation is very evident on the chart
Do on the packet
The lowest temperature is around year 1600 and the highest temperature is in 2000
The coldest temperature in the blue is much colder than the coldest in the red but the warmest blue temperature is fairly similar to the highest red temperature.
It slowly Increases as the years continue
The impact of a climate just one degree celsius warmer by 2100 will have serious impacts on agriculture and coastal regions around the world. It will raise sea levels, hasten extinctions, and impact food production.
Reflection:
Through completing this activity, I have realized how distorted climate change may be presented. While yes the earth has always gotten warmer and colder, we have never experienced highs such as this. This only ends up creating a change of a few degrees. That being said, a change in a few degrees could cause cities to go underwater and cause other huge impacts. These increases in temperature is due to the increased level of carbon dioxide that we are releasing into the air.
Earth was formed around 4.6 billion years ago, yet animals did not emerge until six hundred million years ago. While six hundred million may seem like a big number it is only fifteen percent of the earth’s history. So what exactly was happening on our planet for eighty five percent of its history? 3.6 billion years ago single celled organisms began to form and they ruled the planet for around three billion years.
Now we still have a billion years of unanswered questions. Who ruled the earth for the first twenty two percent of its history? How did life first begin to form on earth? How did single celled organisms evolve into the wide variety of plant and animal life on this planet? What did earth look like when single celled organisms ruled the earth?
For the first twenty two percent of earth’s existence the oxygen levels were too low to support life. How do we know what earth’s oxygen levels were four billion years ago? The reason we know not only of things such as earth’s historical oxygen levels, but how we know that single celled organisms once ruled the earth, how we know that animals emerged only six hundred million years ago, and how we know that the earth is not six thousand years old; the reason why is sedimentary rocks.
Sedimentary rocks are carriers of physiological history, a type of history we often forget about. How exactly do we know that these rocks carry physiological history? Sedimentary rocks are layered, and by breaking apart the layers of these rocks we discover by examining the rocks physical features. How do we know that everything the rocks have taught us is true and will not be later proven false? This is a question I can’t answer, and as one of the professors said in the video, that if we had no unanswered questions, then we would have no need for scientists?
How exactly did life evolve on this planet? Six hundred million years ago due to a drop in the earth’s oxygen levels the entire planet froze over into what we now know as, the ice age. During the ice age glaciers began to form in what we now know as Namibia(where Namibia is currently located was part of the ocean at that time of Pangea). This was one of the hottest places on earth, and the glaciers did not form out of mountains, but rather they formed out of the ocean.
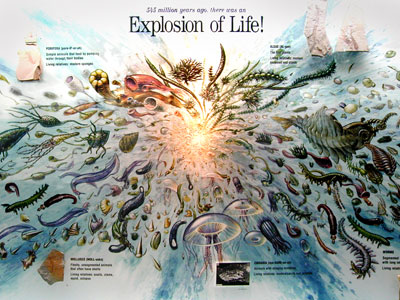
Five hundred thirty million years ago a shift in the earth’s tectonic plates caused the Cambrian Explosion, which lead to two things. The first is a rise in oxygen levels leading to the frozen earth melting, which ended the ice age. The second is the creation of multi celled organisms. From there, multi celled organisms began to evolve into the vast lifeforms that live on earth today.
A major political issue today is whether or not climate change is real. Before I go any further, I am going to define climate is patterns of precipitation, wind, and temperature. Climate change is when climate patterns change, an example of this would be if Whistler became a year round tropical paradise. Now, the reason why natural climate change happens is because of a change in the rate of which energy from the sun arrives and exits the earth.
Studying climate change is very important. 97% of scientists believe that climate change is real, while only 63% of Americans believe climate change is real. When 37% of Americans do not believe climate change is real, that makes studying it very difficult. This is not the only reason why studying climate change is difficult, climate change can occur in just a few years, or it can take place over millions of years(ex.Ice Age). Climate change also varies from being a small regional problem, to being a global problem.
We need to be interested in climate change and overcome the difficulties of studying it. Climate change will effect how we do our farming. Right now the three biggest crops grown in Pennsylvania are wheat, mushrooms, and tomatoes. If climate change patterns continue in the way that they currently are, our agricultural economy will be like Georgia’s, and consist primarily of cotton, peanuts, and tobacco. Now this might happens because high levels of carbon emissions move warmer biomes towards the poles.
I don’t know about you, but I think that water and air are the two most essential things in the world. Climate change causes the quantity and quality of water to change. Climate change also creates droughts, such as the current drought in California. Climate also determines the severity of storms and floods.
Temperatures around the world are rising because of climate change. From 1970 to 2000 the world’s surface temperatures increased 0.6°C, which is 0.02°C per year. 9700 years after an ice age the Vostok Ice Core of Antarctica increased 12°C, which is 0.0013°C per year. This means that temperatures are currently rising 15 times faster now than they were after an ice age.
Direct correlations between temperatures and CO₂ levels in the air exist. The direct correlations give us the ability to hypothesize that climate change is a result of CO₂ levels rising. I use the word hypothesize because while direct correlations do exist, this does not prove a direct causation.
The earth’s surface absorbs energy from the sun and uses it to create heat. When CO₂ and other greenhouse gasses are present it lowers the rate at which heat can be released into space. The more greenhouse gasses there are the lower the rate that heat can escape into space. So when we release CO₂ and other greenhouse gasses into the air it causes heat to be contained into the earth, which causes temperatures to rise. That is proof direct causation between CO₂ levels in the air and change in temperature. Scientist have known this for over one hundred years, yet presidential candidates such as Ted Cruz and Ben Carson still tell the American people that climate change is not real.The three major greenhouse gasses are CO₂(carbon dioxide), CH₄(Methane), and N₂O(Nitrous Oxide). The concentrations of all three of these greenhouse gases have increased rapidly in the last 200 years.
Humans, how exactly are we responsible for climate change. Agriculture, deforestation, coal mining, oil drilling, natural gas extracting, and cement production, is only part of the reason in how humans are affecting climate change. All of these activities release CO₂ and many other greenhouse gasses. Only 50% of the CO₂ released by humans stays in the atmosphere, because the other half go to oceans and other water sources. When CO₂ dissolves in the ocean it forms carbonic acids. The carbonic acids then lead to a decline in the oceans pH levels, making ocean water more acidic.
Now, humans are not the only factors in climate change. Other factors include changes in the input output rate of the sun’s energy, and dust and gasses from volcanic eruptions. Scientific models show that climate change is caused by both humans and nature, however, we can only fight the effects of climate change that we as humans caused.
It is our job and duty to fight climate change. We need to change the way we farm to lower to a way in which we release less greenhouse gasses. We need to reduce the amount of paper we use by technologically doing things such as: writing papers, reading books, sending out flyers, and reading newspapers. We need to support candidates who support renewable energy sources at both the state and federal level. We need to stand up to the oil companies such as ExxonMobil. We need to protest fracking of all kinds. We need to build environmentally sound factories. We need to start investing more in public transportation and start carpooling to work. We need to build cars that don’t run on gas or electricity, but rather cars that run on solar and wind. We need to start building our sidewalks using materials that don’t release greenhouse gasses. We need to start recycling our sewage water into water that can be used to bring water to the dessert.
If you want to learn more here are some fun related videos: Note many of the videos are quite long so unless you have a lot of time on your hands I recommend only watching a few.
Unlike what happened in lesson 1 when we had CO₂ emissions, the gaseous carbon levels atmosphere decreased to only 353ppm by 2100. Now, while the CO₂ did not reach the Prue-industrial levels of below 280ppm it did significantly lower over the next 100 years, while I was around with the simulator I ran it to the year 3000 and in the year 2240 atmospheric carbon levels flat lined at 347ppm.
As you can see, when we have no more fossil fuel consumption there is still an increase in the level of greenhouse gasses in ocean surface and deep ocean, as well as a decrease in soil and terrestrial plants; however, the change is far less drastic than it was in lesson 1.
Questions on Step 2:
A high carbon level will add almost 500GT of CO₂ into the deep ocrean. It is important to keep an eye on the CO₂ levels in the deep ocean because the more CO₂ that is in the ocean the less habitable the deep ocean is.
When decreasing net deforestation to -1.5GT per year and maintaining the 0.3% fossil fuel consumption rate, it actually increases the atmospheric carbon level in 2100 to 540ppm.